Watts Behind the Wire: Making Energy a First-Class Metric in Distributed Design

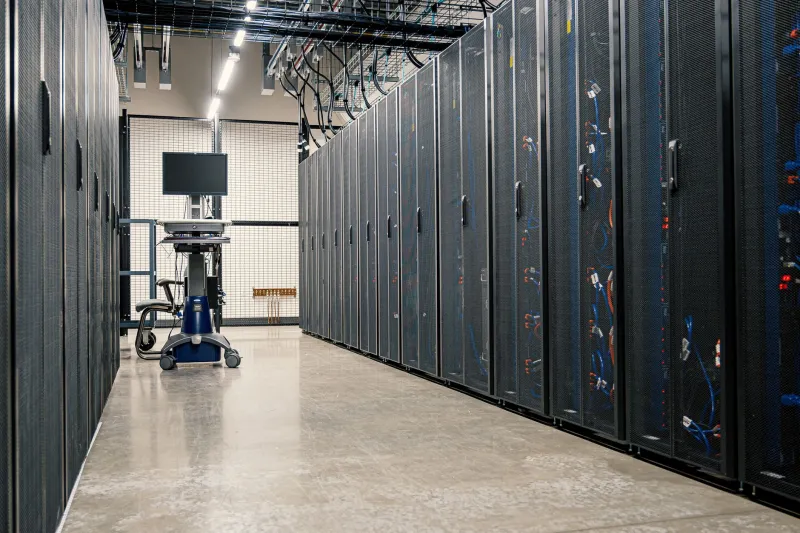
Photo: Cbrasil0, CC BY-SA 4.0, via Wikimedia Commons
Every enterprise architecture review has a familiar shape. Someone opens a dashboard, the conversation turns to p99 latency, and a second slide compares monthly spend per thousand requests. Capacity headroom gets debated. Somebody asks whether the new region is really necessary. What almost never appears on that slide deck is a watt.
That omission was tolerable when distributed systems were a specialty workload. It is not tolerable now. Consensus rounds, cross-region replication, anti-entropy gossip, health-check chatter, and edge nodes that never sleep all consume power continuously — and much of that consumption produces no user-visible work at all. It is the overhead of agreement, and it is invisible to the metrics most teams track.
The third axis of the design triangle
Distributed systems are usually optimized on two axes: latency and cost. Energy behaves like a third axis that is correlated with cost but not identical to it. Two designs can carry the same monthly bill and very different electricity profiles, because cloud pricing bundles power, cooling, networking, and margin into a single rate that varies by region, commitment tier, and instance family.
That decoupling matters. Cost is a proxy for energy, and a leaky one. A team that optimizes purely on invoice size may move workloads to a cheaper region with a dirtier grid, or trade compute for network chatter in ways that reduce spend while increasing draw. Without a separate accounting, those decisions never get surfaced for review.
Where coordination energy actually goes
Before any budget can be set, it helps to name the consumers. In most distributed enterprise estates, the largest hidden draws are consistent across industries:
- Replication traffic. Every write that must land in three availability zones or two regions generates network and storage activity proportional to fan-out, not to user demand.
- Consensus overhead. Quorum protocols exchange messages constantly — heartbeats, vote requests, log shipping, leader leases. Idle clusters are not idle.
- Anti-entropy and repair. Background reconciliation, Merkle tree comparisons, and rebuilds after node churn consume steady power, and spike precisely when the system is already stressed.
- Retries and hedging. Aggressive timeout policies and hedged requests multiply work. The tail-latency improvement is real; so is the duplicated energy.
- Always-on edge presence. Small nodes in many locations look efficient per node and expensive in aggregate, particularly when provisioning is sized for a peak that arrives twice a month.
- Rebalancing churn. Autoscalers and schedulers that react to noisy signals can shuffle workloads continuously without improving anything a user would notice.
Why the meter is hard to read
Honesty about measurement matters here, because the numbers are softer than teams expect. Provider-reported figures are typically allocated rather than marginal: they tell you your share of a facility's average intensity, not the incremental emissions caused by your workload at 2 a.m. Location-based accounting and market-based accounting produce different answers for the same consumption. Power usage effectiveness ratios vary by facility and are reported at different levels of granularity. Shared tenancy blurs attribution further.
The practical conclusion is not to abandon measurement but to lower the precision claim. A carbon budget built on allocated estimates is still useful for comparing design options, because the comparisons are made inside a consistent methodology. It is a decision tool, not a disclosure document.
Building the budget in four steps
1. Establish a baseline by workload, not by account. Tagging discipline is the prerequisite. Group workloads into a handful of categories — transactional core, analytics, edge delivery, background repair — and estimate energy per category using provider data plus a modeled multiplier for network transport.
2. Allocate coordination separately. The most useful split in a distributed estate is between work done for users and work done for agreement. Estimate the replication factor, quorum message rate, and repair frequency for each service, then express coordination energy as a percentage of the service total. This single ratio tends to be the most actionable number in the exercise.
3. Set a ceiling, not a target. A budget works like a spending limit: a constraint that forces a conversation when exceeded. Pick a threshold per service tier and require an explicit justification to breach it, the same way teams justify exceeding a latency SLO.
4. Maintain a trade-off ledger. For each significant design change, record the latency delta, the cost delta, and the energy delta. Over a year, this ledger becomes the institutional memory that prevents the organization from re-litigating the same choices.
Design levers worth pulling
Once the budget exists, several levers become visible that were previously out of frame. Consistency tiers can be assigned per data class rather than per service, so that inventory counts and marketing copy do not inherit the durability guarantees of a ledger. Replica counts can be justified against recovery objectives rather than set by habit. Topology-aware placement can keep the majority of coordination traffic inside a single grid region, reserving cross-region chatter for the small subset of data that genuinely needs it.
Edge provisioning deserves its own review. Idle capacity that is maintained for burst absorption can often be replaced with demand-driven activation, at the cost of a cold-start penalty that many workloads can absorb without complaint. Compression and batched repair reduce background draw with no user-facing effect at all. Scheduler damping — requiring a condition to persist before acting — eliminates a surprising amount of rebalancing churn.
Each of these trades latency, resilience, or operational simplicity against energy. The point of the budget is not to win every trade. It is to make sure the trade is made deliberately.
Who owns the number
The failure mode for most sustainability initiatives is that the metric belongs to a team with no authority over architecture. A carbon budget works only when it sits alongside latency and cost in the same review, owned by the same platform engineering group that approves topology changes.
Report it quarterly. Include it in design documents. Require it in post-incident reviews when a failover caused a week of elevated replication. And accept that the first two quarters of numbers will be rough. Rough numbers that change decisions are worth more than precise numbers that sit in an annual report.