Tracing Everything, Understanding Nothing: The Observability Illusion Hiding Inside Your Distributed Systems

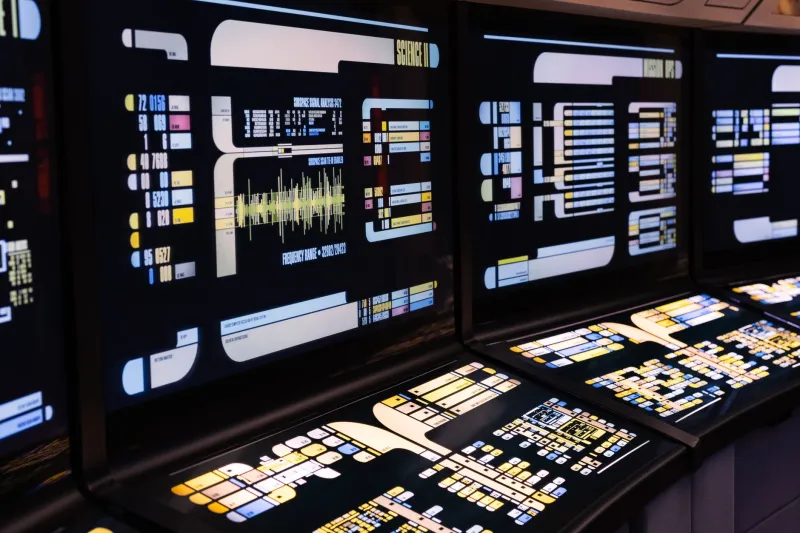
There is a particular kind of confidence that comes from watching thousands of spans populate a tracing dashboard in real time. Every service call is accounted for. Every hop across the network is timestamped. The architecture, rendered as a living graph of interconnected nodes, appears fully legible. For many enterprise IT leaders, this picture represents the fulfillment of a long-standing promise: that distributed systems, however complex, can be made transparent.
That confidence, in many cases, is misplaced.
Across a growing number of large-scale deployments, engineering teams are discovering that their tracing infrastructure—built at considerable cost and maintained with ongoing operational overhead—fails them precisely when they need it most. During a latency event that affects customer-facing services, during a cascading degradation that crosses three or four internal boundaries, the trace data is present and voluminous. What it does not provide, reliably, is an answer to the only question that matters: why is this happening, and where did it start?
The Proliferation Problem
Distributed tracing was designed to solve a genuine and serious problem. In a monolithic application, a slow database query is relatively easy to isolate. In a system composed of dozens of microservices, each communicating asynchronously across a mesh of APIs and message queues, the origin of a performance anomaly can be nearly impossible to locate through conventional logging alone.
Tracing addressed this by threading a unique identifier through every transaction, allowing engineers to reconstruct the full path of a request from ingestion to response. The approach was elegant in theory and, for moderately complex systems, effective in practice.
The difficulty emerges at scale. As service counts grow and transaction volumes increase, the volume of trace data generated becomes its own management challenge. Sampling strategies—designed to reduce storage costs and processing load—introduce selection bias that systematically underrepresents the slow, anomalous requests that engineers most need to examine. High-cardinality traces become expensive to query. Retention windows shorten. The very events that would illuminate a root cause are precisely the ones most likely to be dropped, compressed, or rendered unsearchable by the time an investigation begins.
This is the cascade trap in its most practical form: the infrastructure built to reveal failure modes becomes, at scale, a mechanism for obscuring them.
Correlation Is Not Causation—and Your Traces Know It
Even when trace data is complete and queryable, a more fundamental problem persists. Tracing is, at its core, a correlational technology. It records what happened, in what sequence, with what timing. It does not, by design, explain why a particular service exhibited elevated latency at a particular moment, nor does it distinguish between a symptom and a cause.
Consider a common scenario: a trace reveals that Service C added 340 milliseconds to a transaction that normally completes in under 50. The span data shows the delay clearly. What it cannot show is whether Service C was slow because of an upstream data payload that was unexpectedly large, because a downstream dependency had silently degraded its response SLA, because a shared resource was contended by an entirely separate workload running on the same infrastructure, or because a configuration change deployed six hours earlier altered its internal retry logic.
Each of these explanations implies a different remediation. A team relying solely on trace data will often default to the most visible explanation—the one that appears largest in the span timeline—rather than the most accurate one. In complex systems, these two things are rarely the same.
What Causal Inference Offers Instead
The alternative is not to abandon tracing. It is to treat tracing as one input into a broader observability framework oriented around causal inference rather than event enumeration.
Causal inference, as applied to distributed systems observability, involves instrumenting for relationships rather than events. Rather than asking "what happened during this request?", the framework asks "what changed in this system's environment that correlates with the onset of degradation?" This reorientation shifts attention from span data to systemic signals: resource contention metrics, configuration drift indicators, inter-service dependency health scores, and infrastructure-layer telemetry that sits beneath the application tier entirely.
Several observability platforms operating in the enterprise space have begun moving in this direction, incorporating anomaly detection models that operate across multiple signal types simultaneously rather than surfacing raw trace data for human interpretation. The more sophisticated implementations apply directed acyclic graph (DAG) modeling to system telemetry, attempting to represent the causal structure of the infrastructure and identify which nodes in that structure experienced a state change prior to the onset of a user-visible degradation.
This is meaningfully different from what a trace can tell you. A trace documents a transaction's journey. A causal model attempts to represent the system's behavior as a dynamic structure—one that can be interrogated not just for what happened, but for what would have happened differently under alternative conditions.
Practical Implications for Enterprise IT Teams
For IT leaders evaluating their current observability investments, several practical considerations follow from this analysis.
Audit your sampling strategy with skepticism. If your tracing infrastructure is operating under any head-based or probabilistic sampling regime, you are almost certainly underrepresenting the tail-latency events that drive the most consequential incidents. Tail-based sampling—which retains traces based on their outcome characteristics rather than their ingestion order—is operationally more expensive but diagnostically far more valuable.
Instrument for change, not just state. The most useful signals in a causal investigation are often not the ones that describe what a service is doing, but the ones that describe what changed in its environment. Deployment events, configuration updates, dependency version changes, and infrastructure scaling operations should be treated as first-class observability signals and correlated against performance timelines as a matter of routine.
Resist the completeness fallacy. More spans do not equal more understanding. Engineering teams that have rationalized significant tracing infrastructure investment on the basis of coverage metrics—percentage of services instrumented, percentage of transactions traced—often find that this completeness provides little diagnostic leverage during actual incidents. The question is not whether you are recording everything; it is whether what you are recording is causally relevant to the failure modes you are most likely to encounter.
Invest in structured on-call knowledge transfer. Much of what experienced engineers know about why a particular system behaves the way it does lives outside any observability tool. The institutional knowledge that connects a specific configuration parameter to a specific failure mode, or that recognizes the signature of a particular class of resource contention, represents a form of causal understanding that no tracing platform currently replicates. Structured documentation of past incident analyses—particularly those that revealed non-obvious causal chains—is among the highest-return investments an enterprise IT organization can make in its operational resilience.
The Visibility That Actually Matters
Distributed tracing will remain a legitimate and valuable component of enterprise observability practice. The argument here is not against tracing; it is against the conflation of tracing coverage with genuine system understanding.
The organizations that navigate complex distributed infrastructure most effectively are not necessarily those with the most comprehensive trace data. They are the ones that have built observability strategies capable of distinguishing correlation from causation, symptoms from sources, and the appearance of visibility from its substance.
In an environment where distributed systems grow more intricate with every architectural iteration, that distinction is not academic. It is the difference between resolving an incident in twenty minutes and spending four hours chasing spans through a dashboard that was never designed to answer the question you are actually asking.